Note
Get this example as a Jupyter Notebook ipynb
Reading and Writing ZGY
SEGY-SAK support readying and writing ZGY files via the open-zgy. Currently open-zgy is not available via pip and is baked into the SEGY-SAK release, so it may not be the latest version.
ZGY support is experimental and functionality may change.
Converting SEG-Y to ZGY
ZGY conversion is currently only support via in-memory operations. A dataset must be fully loaded before it can be exported to ZGY.
[1]:
from segysak.segy import segy_loader

ds = segy_loader("data/volve10r12-full-twt-sub3d.sgy")
100%|██████████| 12.3k/12.3k [00:01<00:00, 11.4k traces/s]
Loading as 3D
Fast direction is INLINE_3D
Converting SEGY: 100%|██████████| 12.3k/12.3k [00:03<00:00, 3.79k traces/s]
[2]:
# import ZGY comes with warnings
from segysak.openzgy import zgy_writer

zgy_writer(ds, "data/volve10r12-full-twt-sub3d.zgy")
/opt/hostedtoolcache/Python/3.8.12/x64/lib/python3.8/site-packages/segysak/openzgy/__init__.py:3: UserWarning: ZGY support is experimental and depedenent upon the upstream implementation by OSDU
  warnings.warn(
Warning: ZFP compression is not available: No module named 'zfpy'
seismic store access is not available: No module named 'sdglue'
Reading ZGY
ZGY files can be read back into a dataset by using the zgy_loader function. Because all the information containing geometry is saved in ZGY metadata, no scanning or additional arguments other than the file name are required.
[3]:
from segysak.openzgy import zgy_loader

ds_zgy = zgy_loader("data/volve10r12-full-twt-sub3d.zgy")
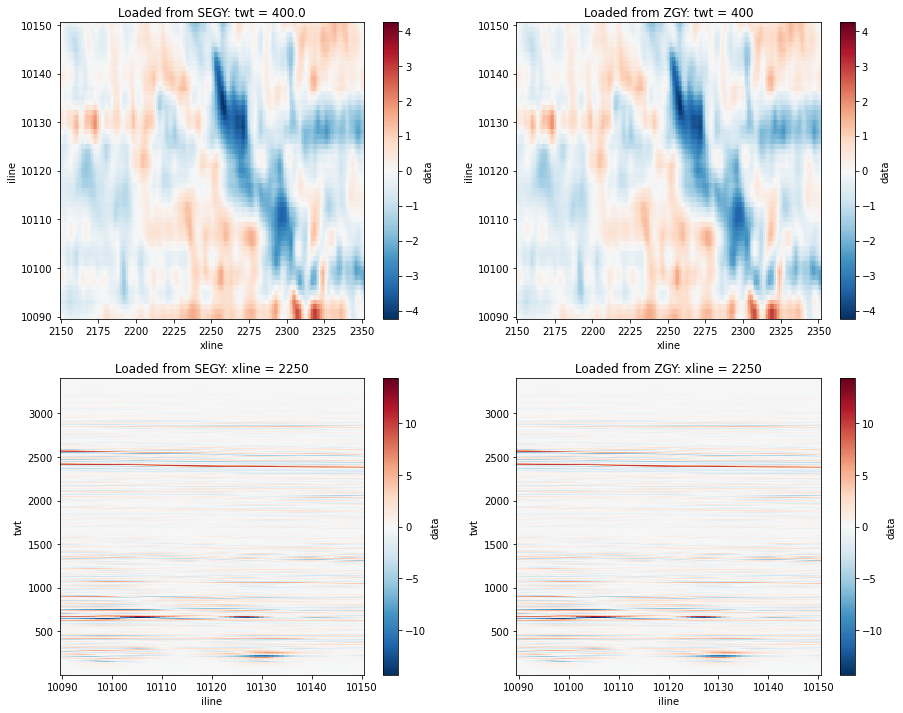
Results
Check that the data looks the same.
[4]:
import matplotlib.pyplot as plt

fig, axs = plt.subplots(ncols=2, nrows=2, figsize=(15, 12))

ds.data.sel(twt=400).plot(ax=axs[0, 0])
axs[0, 0].set_title("Loaded from SEGY: " + axs[0, 0].title.get_text())
ds_zgy.data.sel(twt=400).plot(ax=axs[0, 1])
axs[0, 1].set_title("Loaded from ZGY: " + axs[0, 1].title.get_text())

ds.data.sel(xline=2250).T.plot(ax=axs[1, 0])
axs[1, 0].set_title("Loaded from SEGY: " + axs[1, 0].title.get_text())
ds_zgy.data.sel(xline=2250).T.plot(ax=axs[1, 1])
axs[1, 1].set_title("Loaded from ZGY: " + axs[1, 1].title.get_text())
[4]:
Text(0.5, 1.0, 'Loaded from ZGY: xline = 2250')
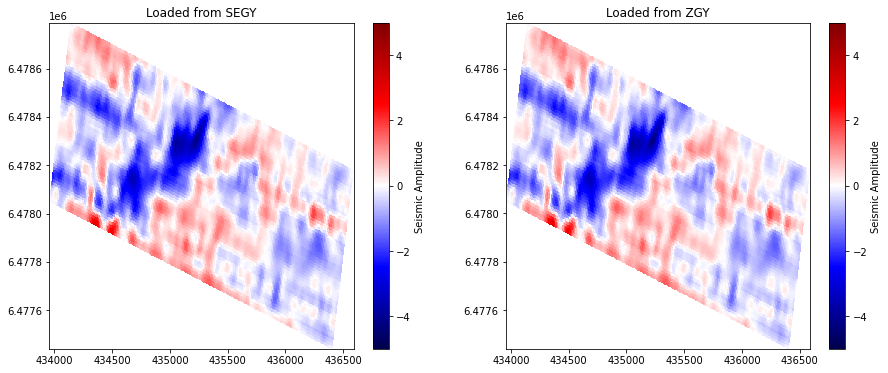
Check that the global coordinates are the same.
[5]:
fig, axs = plt.subplots(ncols=2, figsize=(15, 6))

p1 = axs[0].pcolormesh(
    ds.sel(twt=400).cdp_x,
    ds.sel(twt=400).cdp_y,
    ds.sel(twt=400).data,
    cmap="seismic",
    vmin=-5,
    vmax=5,
    shading="auto",
)
plt.colorbar(p1, ax=axs[0], label="Seismic Amplitude")
axs[0].set_title("Loaded from SEGY")

p2 = axs[1].pcolormesh(
    ds_zgy.sel(twt=400).cdp_x.values,
    ds_zgy.sel(twt=400).cdp_y.values,
    ds_zgy.sel(twt=400).data.values,
    cmap="seismic",
    vmin=-5,
    vmax=5,
    shading="auto",
)
plt.colorbar(p1, ax=axs[1], label="Seismic Amplitude")
axs[1].set_title("Loaded from ZGY")
[5]:
Text(0.5, 1.0, 'Loaded from ZGY')